STATE MARKET REPORT

Kia Carnival Market in Kansas
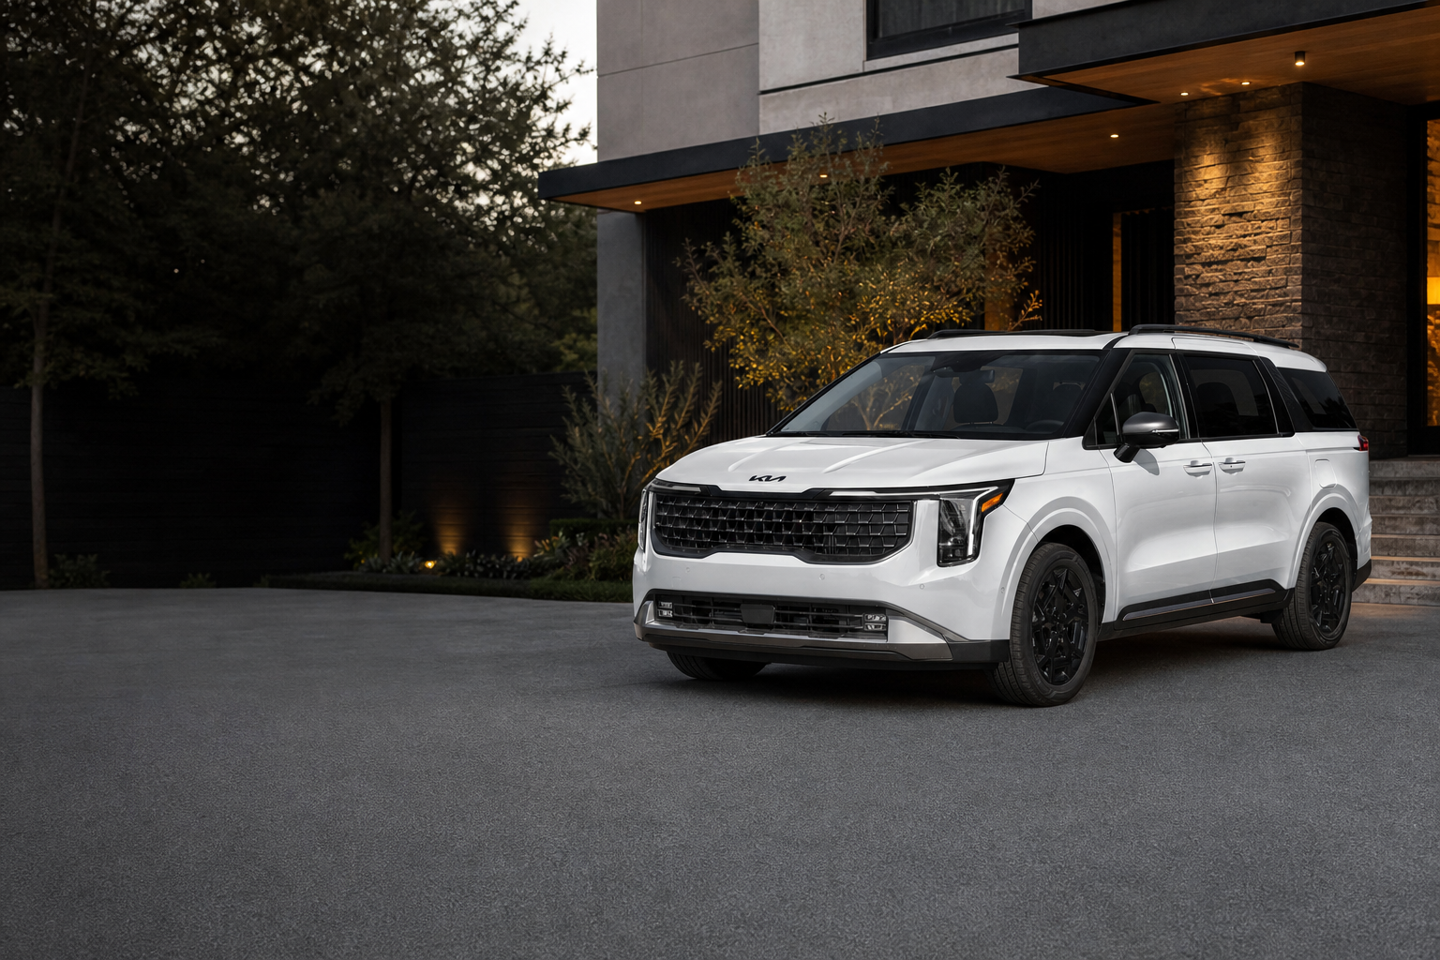
Reporting period: October 2026 (sold data) Condition: New Data source: Dealer sample Listings updated Nov 8, 2026 Cold market

Kia Carnival in Kansas

The answer

What is the Carnival market like in Kansas right now?

As of the latest daily snapshot, our dealer sample shows 97 new Kia Carnival listings observed in Kansas at a median asking price of $45,886 (+4.1% vs. the national median). The market reads as cold. Listings average 63 days on market.

Observed Data source: Dealer sample (new vehicles) · Listings updated Nov 8, 2026 · Sold data: October 2026
Median asking price
$45,886
The midpoint of current asking prices
Average days on market
63
More time on lot can mean more leverage
Units sold last month
28
Demand still leaves negotiating room
Observed listings
97
Wider selection helps shoppers

Market read

Should you buy now or wait?

Market temperatureCompares the vehicle supply available in the state with how quickly vehicles have been leaving that market, expressed as an estimated days of supply — lower means supply is tighter relative to that pace. It is not a measure of how long individual listings have been listed, and it is shown only where our market-data provider has enough state-level supply and sales history to support it.
Cold market
Available supply is well ahead of how quickly vehicles have been leaving this market. That can strengthen a buyer's position to negotiate.
Buyer leverageHow much negotiating power you have right now, based on inventory, selling speed, and price movement. Stronger leverage means more room to negotiate.
Strong buyer leverage
Dealer sampleFigures reflect new-vehicle listings observed in our licensed dealer-listings sample. They may not represent every vehicle for sale in the state; figures below our threshold are withheld, not estimated.
Dealer sample

Verdict: Timing read for the Carnival market in Kansas: negotiate — prices are down -5.7% and listings average 63 days on market.

Price & value

How much does a Kia Carnival cost in Kansas?

Across Carnival trims in Kansas, the median asking price is $45,886, a +4.1% difference from the national median.
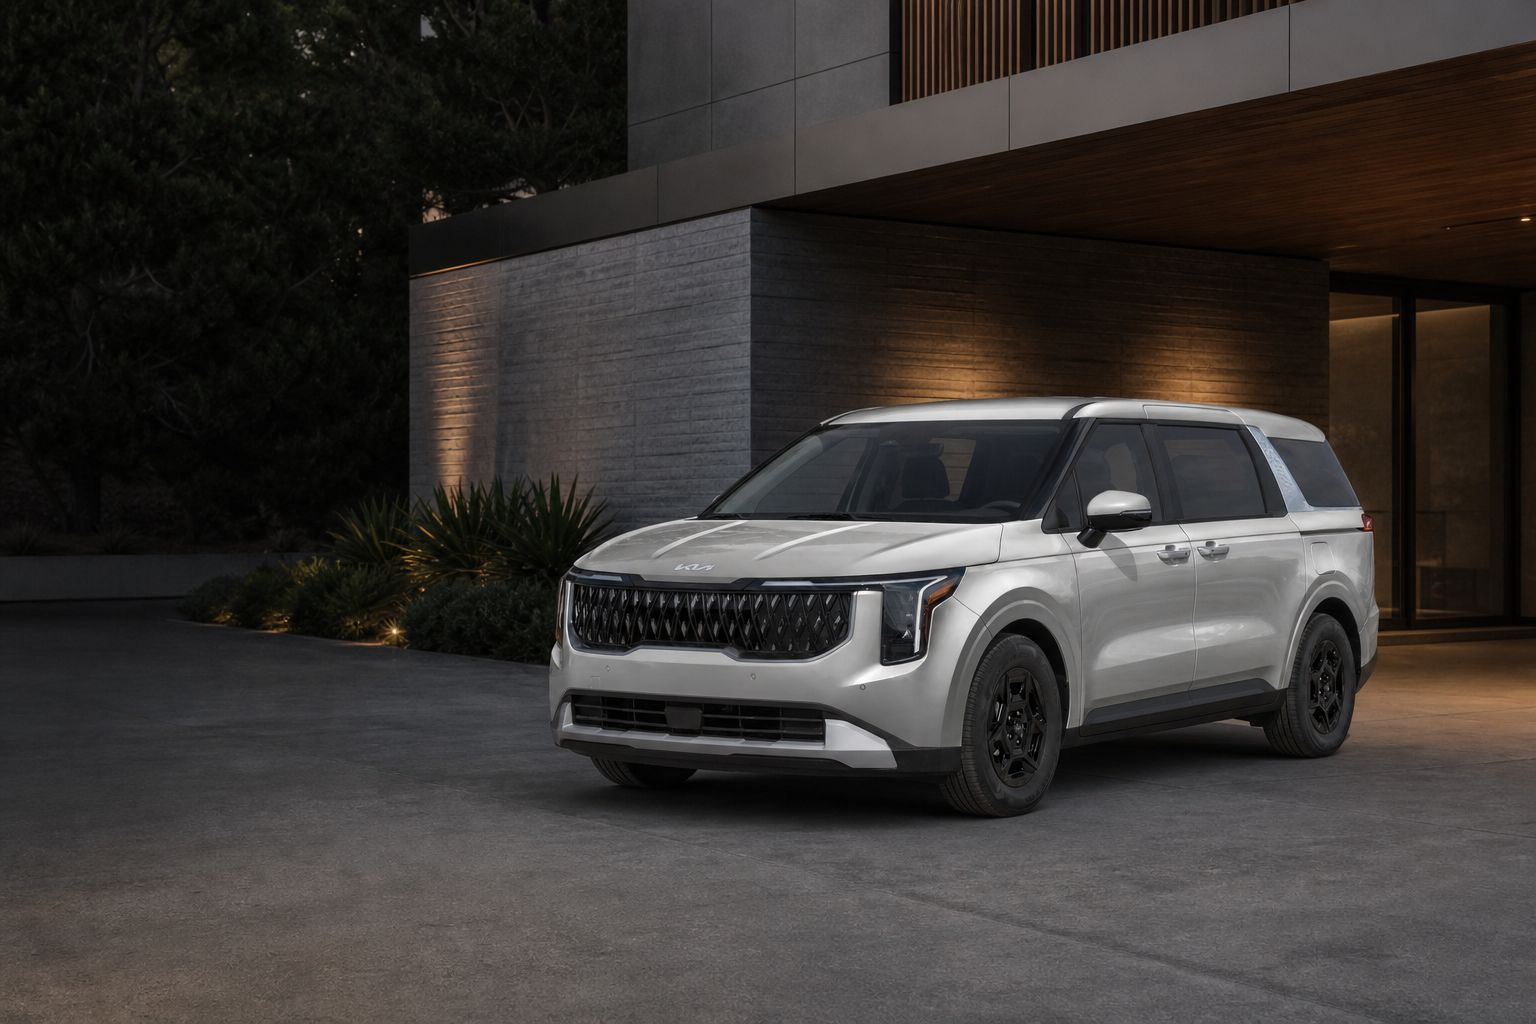
LX$38,335
LXS$40,410
EX$42,631
SX$46,898
SX Prestige$50,631

Compare trims nationally

Sponsored

Get Invoice Price on a New Carinval

Find Out What the Dealer Paid!

Get Invoice Price

Availability

How much Carnival inventory is available in Kansas?

Unique vehicles for sale
97
Observed
New arrivals
Limited data
Most available
SX
Hardest to find
LX

Trim mix

SX39%
EX32%
SX Prestige12%
LXS9%
LX7%

The SX is the most available trim; the LX is the scarcest. About 97 Carnival listings are observed, led by the SX.

Find Carnivals near me

Demand

How fast are Carnivals selling in Kansas?

Units sold
28
Observed
Average days on marketThe average number of days the currently listed, unsold vehicles have been on the market. Listings that sit longer can mean more room to negotiate.
63
Sell-throughThe share of available inventory that sells in a given period. Higher sell-through means cars are moving quickly.
Limited data
Limited data
Days of supplyAn estimate from our market-data provider of how long the vehicle supply available in this state would last at the pace vehicles have recently been leaving that market. It is the provider's own calculation, not a division of the listing and sales counts shown on this page. Higher days of supply usually means more choice and more negotiating room.
165 days
Estimated

Average days on market by trim (fastest first)

LXS40 days
EX49 days
SX66 days
SX Prestige91 days
LX95 days

Carnivals here average 63 days on market.

Sold prices & volume

What are Carnivals actually selling for in Kansas?

Observed from recently sold Carnival transactions — shown separately from the asking prices above.

Units sold
28
Observed
Average sold price
$46,932
Observed
Lowest sold price
$40,886
Observed
Highest sold price
$56,058
Observed
Average days to sell (sold)
52
Observed

Sold figures reflect completed transactions and are kept separate from asking prices and active-listing days on market.

Buyer leverage

Where do buyers have the most leverage?

LX — The LX shows strong buyer leverage at 95 days to sell.

LX Strong buyer leverage Average days on market95 Price trend—
LXS Moderate buyer leverage Average days on market40 Price trend—
LXS Hybrid Balanced Average days on marketLimited data Price trend—
EX Moderate buyer leverage Average days on market49 Price trend—
EX Hybrid Balanced Average days on marketLimited data Price trend—
SX Strong buyer leverage Average days on market66 Price trend—
SX Hybrid Balanced Average days on marketLimited data Price trend—
SX Prestige Strong buyer leverage Average days on market91 Price trend—
SX Prestige Hybrid Balanced Average days on marketLimited data Price trend—

Timing & momentum

Is now a good time to buy a Carnival in Kansas?

Timing read: negotiate — derived from the price trend and demand shown above.

Prices are down -5.7%, sales volume is steady, demand is cooling at 63 days on market.

Price
Prices down (-5.7%)
Sales volume
Sales volume steady
Demand
Demand cooling
Average asking price · recent months (feed history)
▼ Prices trending down — better negotiating window
Carnival average asking price in Kansas, recent months (feed history)Prices are down -5.7%, sales volume is steady, demand is cooling at 63 days on market.$44057$45687$47317$48947Jul '25Nov '26

Average asking price from the feed's observed history — a different statistic from the median asking KPI above.

Monthly sales volume · recent months
Carnival monthly sales volume in Kansas, recent monthsTrend history is still buildingTrend history is still building

Units sold per month from the feed's observed history; withheld when it conflicts with the observed monthly total above.

Sponsored

Get Invoice Price on a New Carinval

Find Out What the Dealer Paid!

Get Invoice Price

Shop

Carnival listings in Kansas

A snapshot of representative listings. There are about 97 Carnival listings in Kansas this month.

$38,042
2027 Carnival LX · Lawrence, KS
Lowest price
$38,197
2027 Carnival LX · Lawrence, KS
Below MSRP
$38,335
2027 Carnival LX · Topeka, KS
Below MSRP
$38,512
2027 Carnival LX · Lawrence, KS
Below MSRP
$39,953
2027 Carnival LXS · Mission, KS
Below MSRP
$40,410
2027 Carnival LXS · Lawrence, KS
Below MSRP

See Carnival inventory in Kansas

Reference

Understanding the terms

Plain-language definitions for the market measures used in this report — and why each one matters when you're shopping.

Market temperature
Compares the vehicle supply available in the state with how quickly vehicles have been leaving that market, expressed as an estimated days of supply — lower means supply is tighter relative to that pace. It is not a measure of how long individual listings have been listed, and it is shown only where our market-data provider has enough state-level supply and sales history to support it.
Buyer leverage
How much negotiating power you have right now, based on inventory, selling speed, and price movement. Stronger leverage means more room to negotiate.
Average days on market
The average number of days the currently listed, unsold vehicles have been on the market. Listings that sit longer can mean more room to negotiate.
Days of supply
An estimate from our market-data provider of how long the vehicle supply available in this state would last at the pace vehicles have recently been leaving that market. It is the provider's own calculation, not a division of the listing and sales counts shown on this page. Higher days of supply usually means more choice and more negotiating room.
Sell-through
The share of available inventory that sells in a given period. Higher sell-through means cars are moving quickly.
Dealer sample
Figures reflect new-vehicle listings observed in our licensed dealer-listings sample. They may not represent every vehicle for sale in the state; figures below our threshold are withheld, not estimated.
Observed listings
The number of distinct new vehicles observed in our dealer-listings sample at the latest daily snapshot — not a count of every vehicle for sale in the state.
Observed
A measured value taken from observed listings or sales — not modeled.
Estimated
A modeled value. It is clearly labeled and never presented as a measured figure.
Methodology

Where these numbers come from

Figures on this report are computed from a licensed multi-dealer listings and sales feed for the Kia Carnival (new vehicles only), reduced to Kansas. Two clocks apply: listing figures come from the 97 new listings observed in our dealer sample at the latest daily snapshot (Nov 8, 2026); sold-price and sales-volume figures cover the prior completed calendar month (October 2026) and are kept separate from asking prices. The dealer sample may not represent every vehicle for sale in the state. Values below our reporting threshold are withheld — never estimated — and every figure is labeled Observed or Estimated. Trend history reflects the feed's retained months and can lag the reporting period.

Market temperature compares the Kia Carnival supply available in the state with how quickly vehicles have been leaving that market, expressed as an estimated days of supply — lower means supply is tighter relative to that pace. The days-of-supply figure is calculated by our market-data provider. It is not a measure of how long individual listings have been listed, and it is published only where the provider has enough state-level supply and sales history to support it.

Questions

Frequently asked questions

How much does a Kia Carnival cost in Kansas?
Across Carnival trims in Kansas, the median asking price is $45,886, a +4.1% difference from the national median.
Is now a good time to buy a Carnival in Kansas?
Timing read for the Carnival market in Kansas: negotiate — prices are down -5.7% and listings average 63 days on market.
How fast do Carnivals sell in Kansas?
Carnivals in Kansas take about 63 days to sell on average. Carnivals here average 63 days on market.
How much Carnival inventory is available in Kansas?
Our dealer sample currently shows 97 new Carnival listings observed in Kansas. The SX is the most available trim; the LX is the scarcest.
How complete is this report's data?
These figures come from our dealer sample — the 97 new Carnival listings observed for this report. They may not represent every vehicle for sale in the state, we don't publish a market-wide coverage percentage, and we withhold any figure below our reporting threshold rather than guess.